
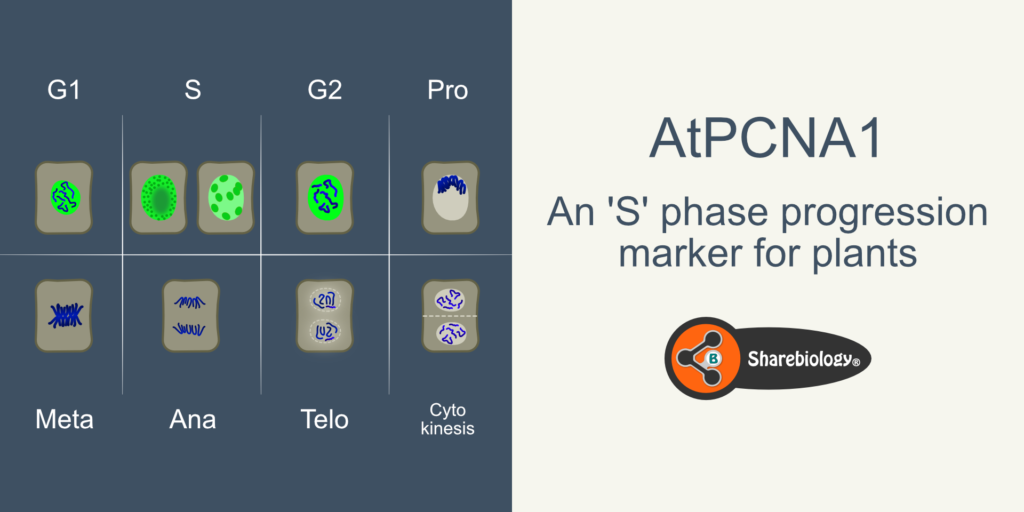
AtPCNA1-An ‘S’ phase progression marker for plants
Introduction
Proliferating cell nuclear antigen (PCNA) is a trimeric donut-shaped protein. It wraps around the DNA and acts as a scaffold for many proteins involved in DNA replication and repair. A notable function of PCNA is the processivity factor for DNA polymerase.
The Arabidopsis genome harbors two homologs of PCNA, i.e., PCNA 1 and PCNA 2. In 2013, Wojciech Strzalka et.al reported that the Arabidopsis two homologs can form homo or hetero trimers.
In this study, the authors have used AtPCNA1 as a marker for S-phase progression.
Markers (Constructs used)
pAtPCNA1::AtPCNA1-sGFP.
AtPCNA1 genomic sequence is expressed under native promoter tagging sGFP at the C-terminal.
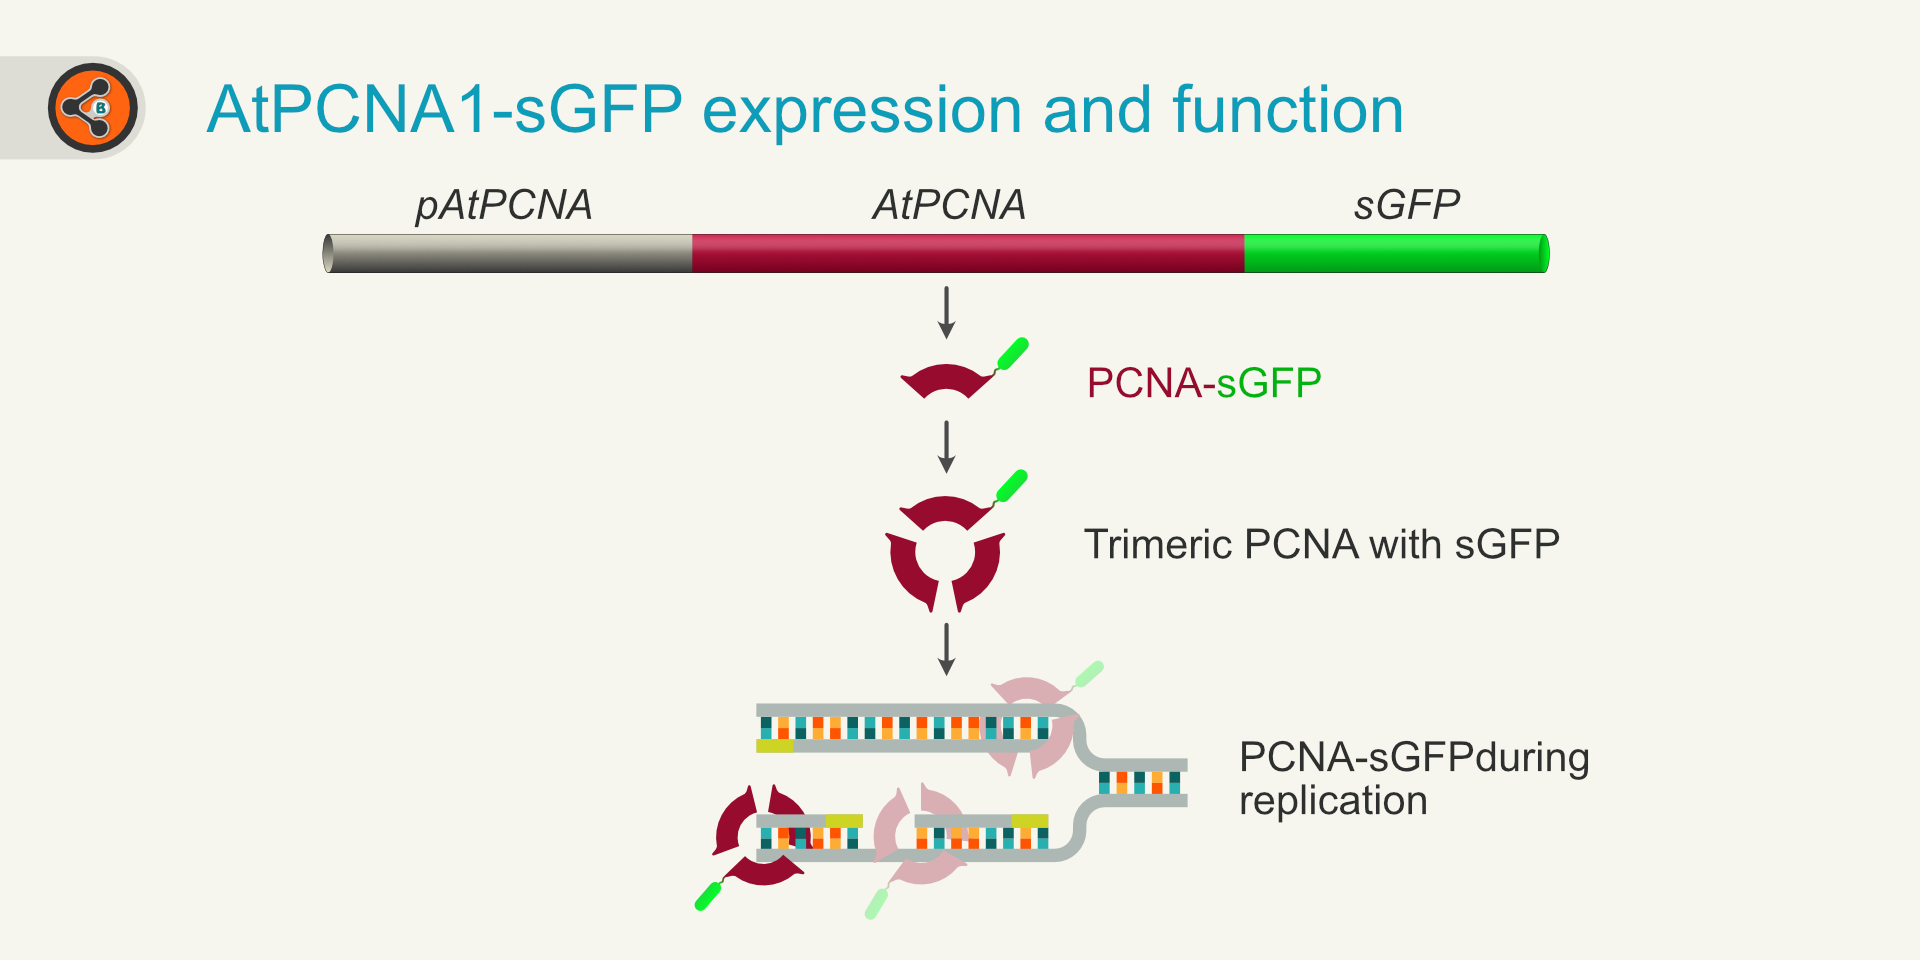
Figure 1: An illustration showing the expression and function of AtPCNA-sGFP. *For simplicity, in the trimeric PCNA, only one unit was shown to have GFP.
Behaviour during cell cycle phases
G1 Phase
Uniform distribution of signal throughout the nucleoplasm is observed in the G1-phase. This pattern is called “whole” (Fig 2. G1-phase).
S Phase
The S phase can be divided into early and late phases based on the replication of euchromatin and heterochromatin, respectively. During the early-mid S-phase, within the uniformly distributed pool, small speckles appear. These speckles have an intensity that ranges from 1.1-1.4 units in comparison to the surrounding signal. These tiny speckles were named “dots.” As the S-phase progresses (late S-phase), the nuclei show bigger speckles that are comparatively large and have higher intensity (>1.4). These were named “speckles.” The speckles are the location of DNA replication foci.
G2 Phase
After the completion of replication, PCNA shows uniform distribution (whole).
M Phase
Absent throughout the M-phase.
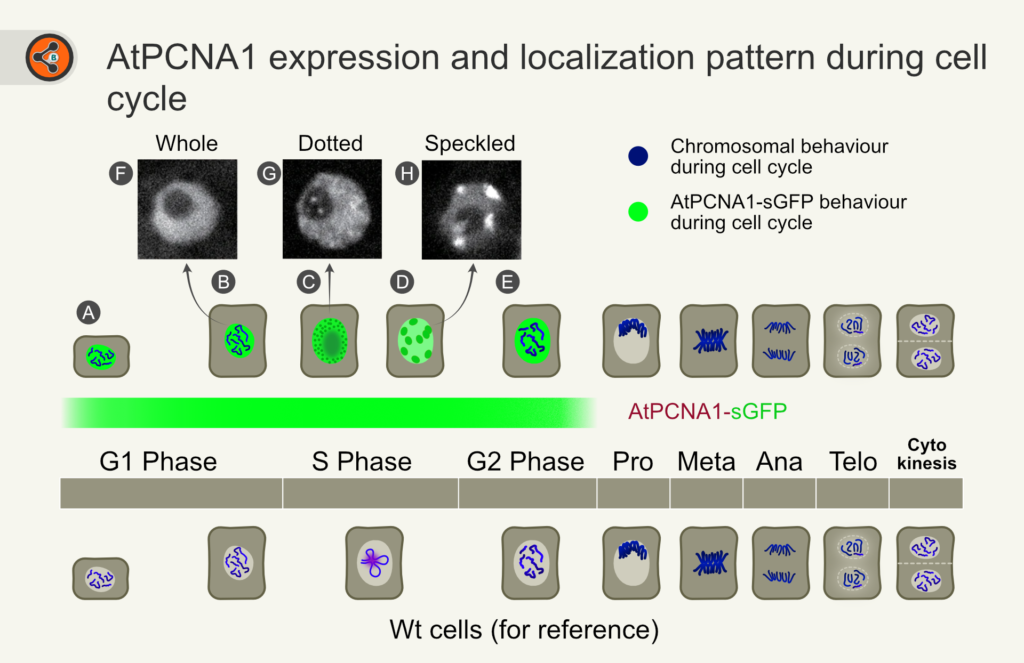
Figure 2: Illustration showing the expression range and the pattern of AtPCNA1 during the cell cycle. AtPCNA1-sGFP starts from the G1 phase and disappears at the end of the G2 phase (shown as a green horizontal bar). PCNA appears as tiny speckles (dots) in the early to mid-S-phase. In the late S-phase, it appears as big blobs (speckles). Chromatin and chromosomes are shown in blue. The nucleus is shown in white, and the cytoplasm is shown in grey.
Advantages
- Only marker at present to track the progression of the S-phase in live plant cells/tissues.
- Since PCNA is a critical component of DNA replication machinery, it is likely to be present in all cells, including special cells like gametes. Riha et al. demonstrated the use of PCNA as an S-phase marker during male gamete formation.
Disadvantages
- DNA damage may allow pseudo speckle formation.
- Differentiated cells show the whole signal, so it is difficult to distinguish the cells in G1, G2, or differentiated from the marker standpoint alone.
- It may be hard to observe the very beginning of the S-phase as the intensity of the dots (signal intensity) is significantly less than the background intensity. This situation can worsen as the chemical treatments involved in the workflow would quench the fluorescence.
- Although the PCNA is used for the progression of the S-phase, it is more of a qualitative assessment. Currently, there are no studies in Arabidopsis showing the relation between the size of dots/speckles to the progression of the S-phase. This data could help assess the time of the S-phase from a snapshot of the nuclei rather than needing time-lapse data. However, the problem gets more complex as the absolute dot/speckle size may not correlate with the progression of the S-phase in the cells in all ploidy levels.
- Naturally expressing PCNA may not suffice for the detection in all cell types. Boosting the expression may trigger cell cycle abnormalities. However, the signal can be improved using fluorescent proteins with high brightness (SB FP DB link) or fluorescent probe tagged antibodies (in fixed cells).
Expressed in
- Leaf epidermis
- Trichome
- Hypocotyl
- Root meristematic zone
- Root elongation zone
- Root differentiation zone
- Lateral root primordium
Does not express in
Not reported in any cells/tissues
Availability of plasmids or marker lines
Not available from NASC and TAIR at the time of publication.
DIY(Primers and DNA sequences)
Gene ID: AT1G07370
TAIR link: https://www.arabidopsis.org/servlets/TairObject?id=29065&type=locus
Primers used in the article:
Forword primer: 5’ GGGCAAAGTCGGTTTTGGA 3’
Reverse primer: 5′ GGGATTAGTGTCTTCTTCTTCTTCA 3′
Acknowledgments
Fig 2 microscopy images were obtained from fig 2 of the following article.
Yokoyama, R. et al. Dynamics of plant DNA replication based on PCNA visualization. Sci. Rep. 6, 29657; DOI: 10.1038/srep29657 (2016).