
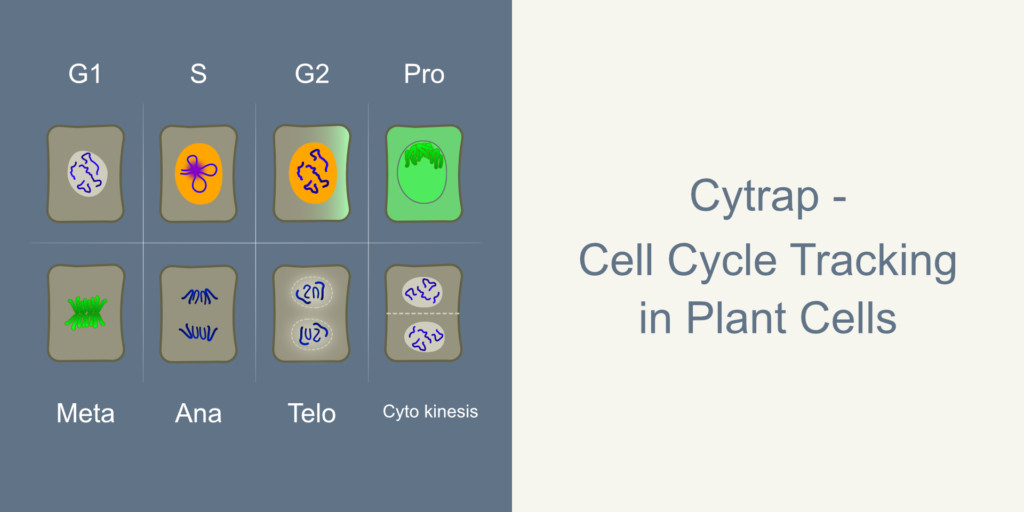
Cytrap (Cell Cycle Tracking in Plant Cells)
Introduction
Cytrap is a dual-color cell cycle marker system that allows tracking cell cycle phases in live cells/tissue. This could be the first of its kind in plants equivalent to the FUCCI system of animals. In Cytrap lines, cells present in the S phase and G2 phase are highlighted in red (mRFP), and cells in late G2, Prophase, and metaphase are highlighted in green (GFP). A window of an hour (late G2) in which both markers are present.
For marking the S-G2 phase, the authors have used CDT1, a protein involved in DNA licensing. The role of it is the topic for another day. What is important here is, it expresses soon after cell division and degrades at the time of DNA replication initiation (beginning of S phase). However, a fragment of it, specifically the C terminal region (C3 domain), degrades at the end of the G2 phase instead of G1. Expressing this fragment under S phase-specific promoter (HTR2) allowed the researchers to create a marker that starts showing up at the beginning of the S phase and disappears at the end of G2, i.e., S-G2 marker (Fig 2).
For marking the M phase, the authors have used a well-established marker CYCB1;1 under native promoter. CYCB1;1 is a cyclin that expresses from the late G2. The protein degrades during the transition from metaphase to anaphase.
Markers (Constructs used)
Cytrap system has the following markers
1. pHTR2::CDT1a (C3)-RFP:
This construct is a chimera of
HTR2 promoter: For a higher level of expression and S phase-specific expression. On the contrary, the CDT1a promoter has broad expression, and the expression level is low compared to HTR2.
CDT1a (C3): The Arabidopsis genome harbors two CDT1 genes CDT1a and CDT1b. Overexpression of CDT1a protein was reported to change the cell division pattern and ploidy. So, the authors have used a C-terminal part of the protein (C3) for high expression levels without affecting the typical division pattern. CDT1a full-length protein expresses soon after mitosis and degrades rapidly at the beginning of the S phase. However, C3-CDT1a degrades at the end of the G2 phase.
2. pAtCYCB1::AtCYCB1-GFP: Cyclin B1;1 is a B class cyclin widely used for marking late G2 to metaphase. The degradation of CYCB1;1 leads to the beginning of anaphase.
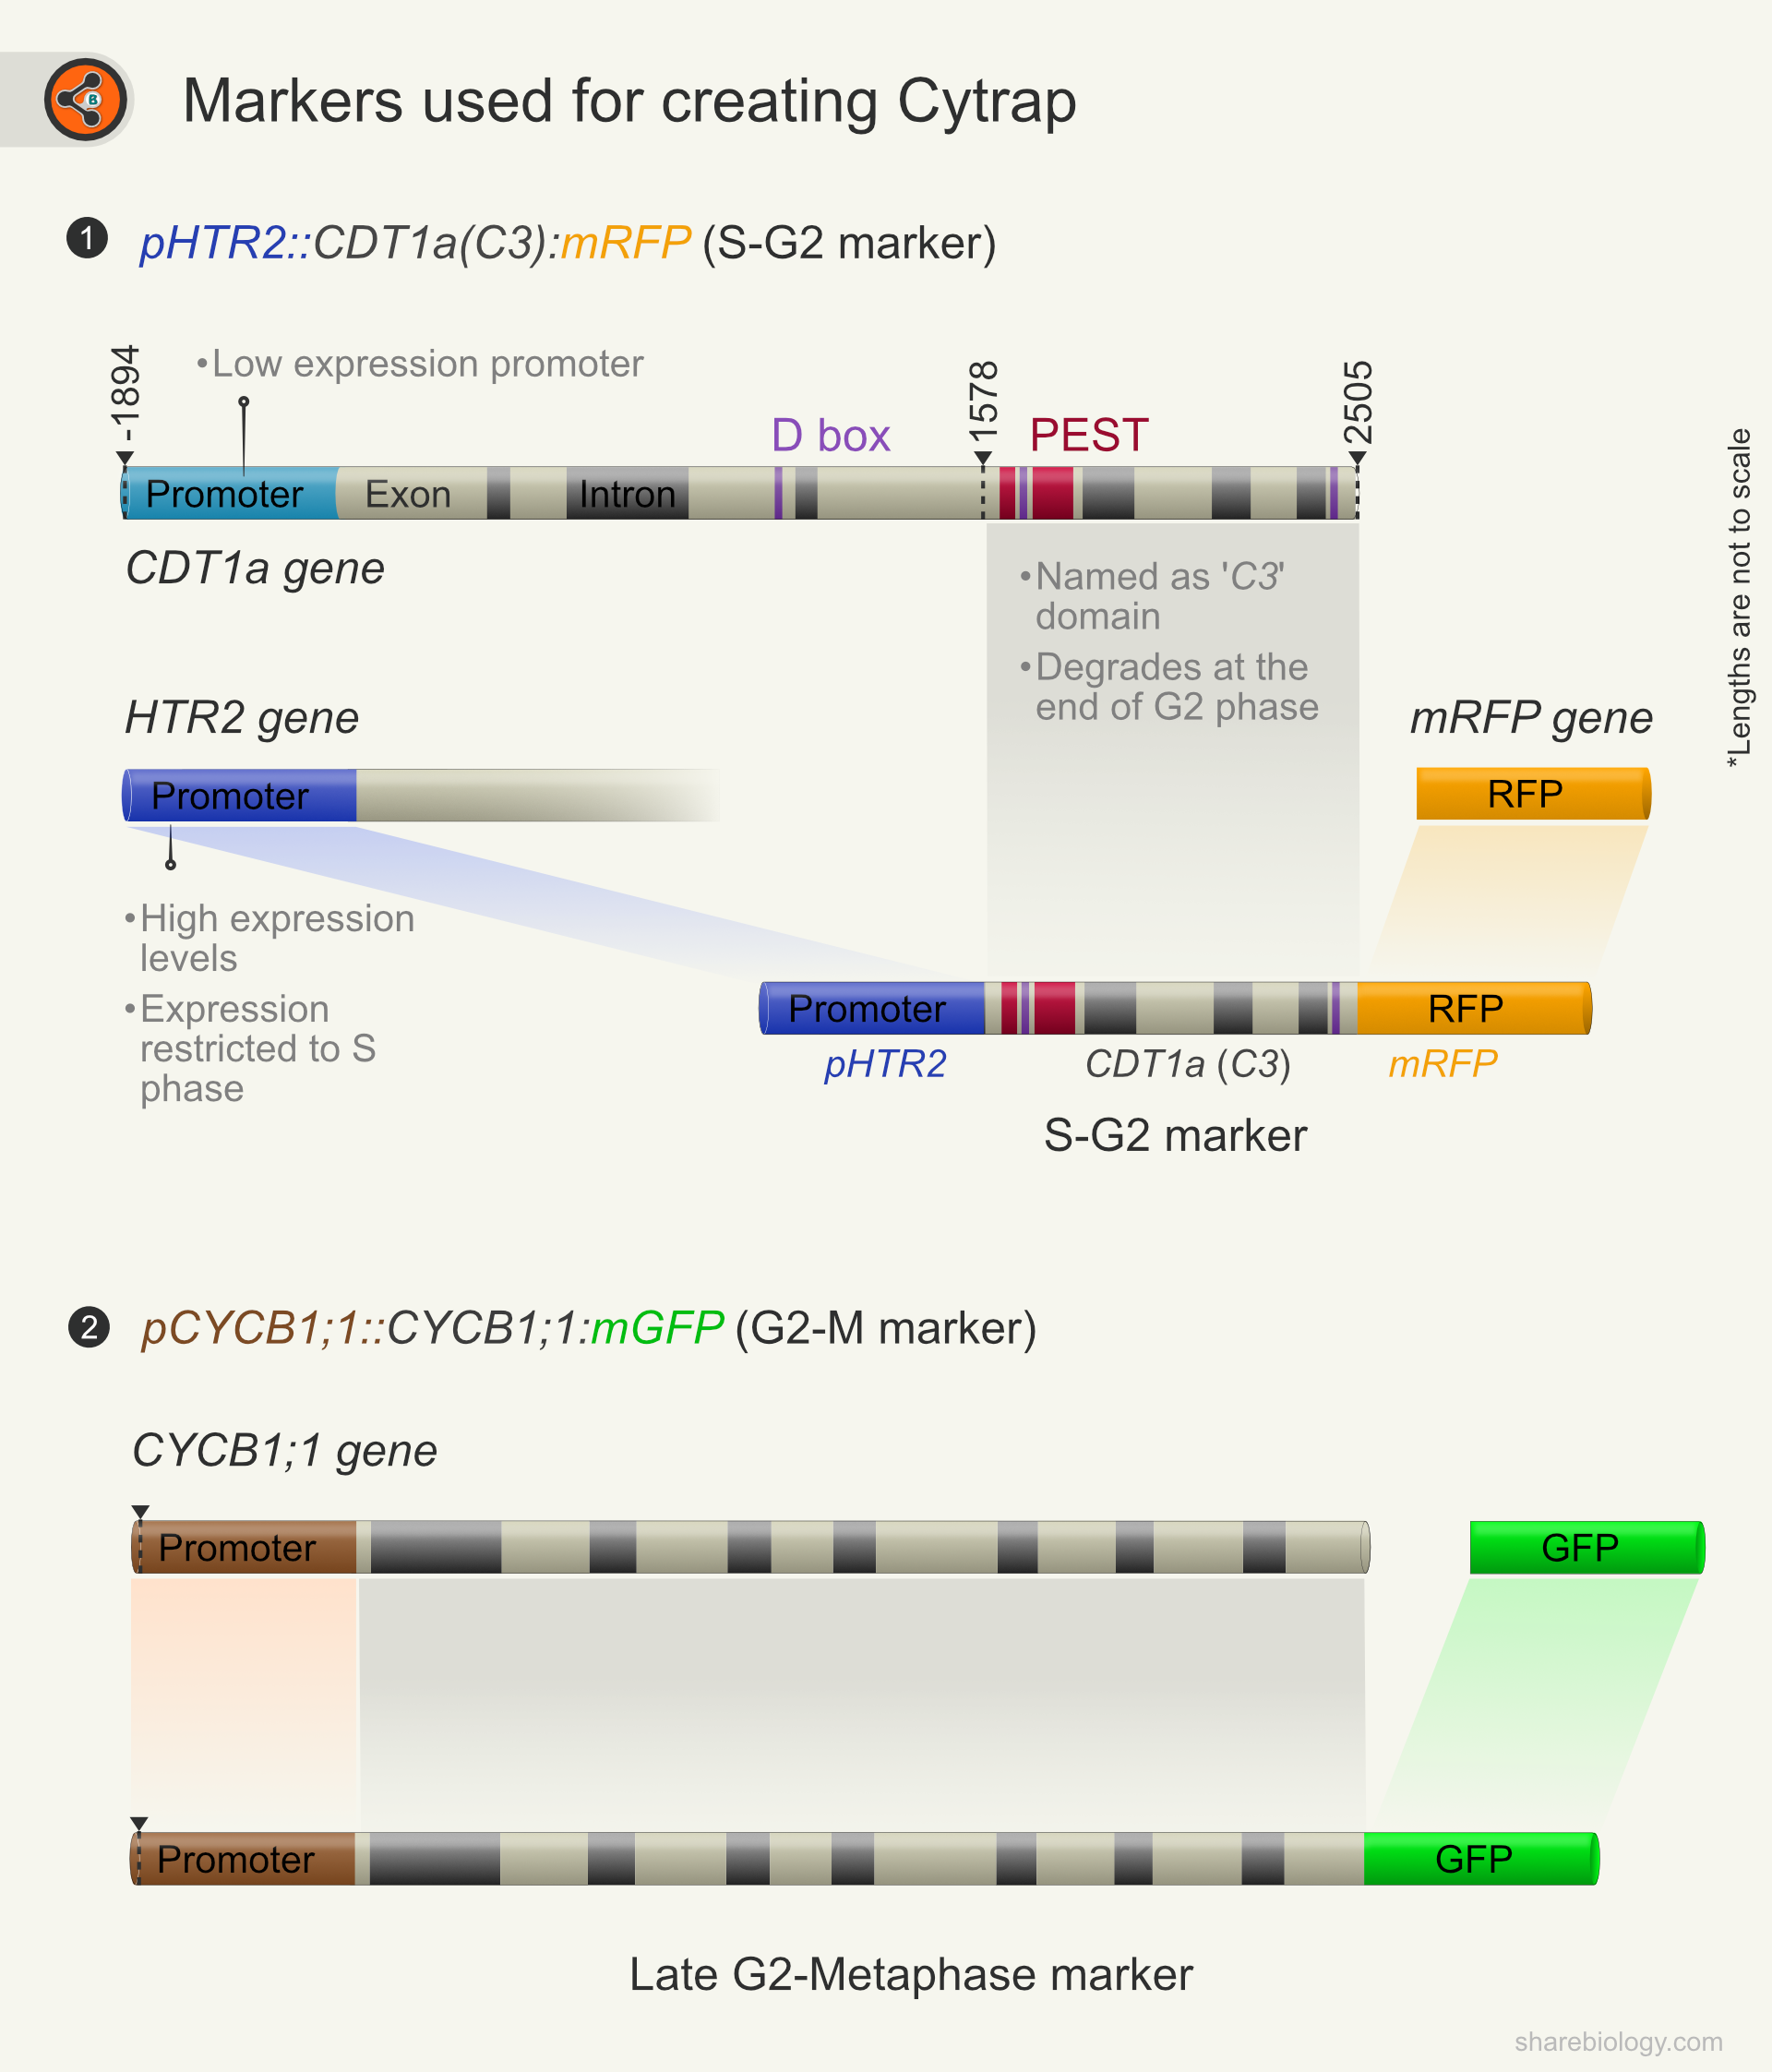
Figure 1. Illustration depicting markers used and cloning strategy for the generation of Cytrap
Behavior during cell cycle phases
G1 Phase
None; Lack of both the marker’s expression can signify G1. However, the anaphase, telophase, and G0 phases show the same property. The later stages may be distinguishable by cell shape, size, and association with their neighbors.
S Phase
The presence of red fluorescence is due to the expression of CDT1a(C3)-mRFP.
G2 Phase
In the G2 phase, both red and green fluorescence can be seen. Red fluorescence predominates in the major part of G2, which disappears by the end of G2. Green fluorescence starts about an hour before the transition between G2/M. So, in the last part of the G2 phase, cells show both red and green fluorescence.
M Phase
Prophase: Presence of green fluorescence in the nucleus.
Metaphase: Metaphasic chromosomes are highlighted in green.
Anaphase: No fluorescence
Telophase: No fluorescence
G0 Phase
No fluorescence.
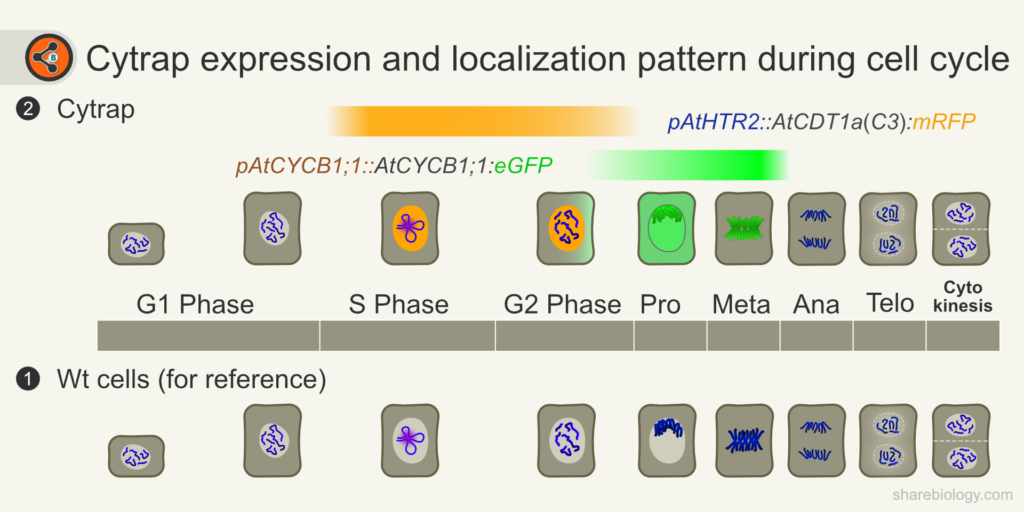
Figure 2: Illustration depicting cell cycle phases and Cytrap expression window and marker’s localization. 1.1 The cells refer to division events in wild-type cells. 1.2 Cytrap line during the cell cycle. Orange and green bars represent expression duration of S-G2 and late G2-metaphase markers respectively. Light grey=nucleus; dark grey = cytoplasm; Blue = chromatin/chromosomes. *Chromatin in the wt cells is showing loops to represent replication foci.
Advantages
- It is optimized for marking S and G2 phases in comparison with overexpression lines.
- Metaphase can be marked due to localization of cycB1;1.
Disadvantages
- Since the CTD1a C-terminal domain does not express as the full-length protein in the elongation zone, the S-G2 phase may not be detectable in all cell types. Or, at least the marker expression needs to be confirmed first.
- Lack of resolution for the progression of the S phase (Use PCNA for S phase progression).
- Can not distinguish S from G2 due to the same maker used for both stages.
- Anaphase, telophase, G1, and G0 phases can not be resolved due to no fluorescence.
- Since the two markers are not on the same plasmid (thus different loci in the genome), homozygous line generation takes time after crossing with our line interest.
- CycB1;1 expression was reported during DNA damage, so it is possible to misinterpret CycB1;1 expression in DNA damaged cells with late G2-M.
Expressed in
- Roots
Availability of plasmids or marker lines
Not available from NASC and TAIR at the time of publication.